Almost every NGO that applies for institutional funding eventually meets the logframe. For some teams it is a helpful thinking tool; for others it is a grid that gets filled in the night before a proposal deadline. This guide explains the logical framework approach as it was intended to be used: as a structured way to analyse a problem, choose a strategy and set out what success will look like, so that the matrix at the end is a genuine summary of good thinking rather than a box-ticking exercise.
We will walk through each stage using a fictional but realistic example: a small water, sanitation and hygiene (WASH) NGO working with rural primary schools. By the end you should be able to build a logframe that your team understands, your donor accepts and your monitoring officer can actually use.
What is the logical framework approach?
The Logical Framework Approach (LFA) is a project design method developed for USAID at the end of the 1960s and later adopted, in adapted forms, by many bilateral donors, the European Commission’s Project Cycle Management guidance and countless NGOs. It has two broad phases:
- The analysis phase, in which you look at stakeholders, problems, objectives and alternative strategies.
- The planning phase, in which you turn the chosen strategy into a logframe matrix, then into an activity schedule and a budget.
The key insight of the approach is that a project is a set of linked hypotheses: if we carry out these activities, we will deliver these outputs; if we deliver these outputs, and certain assumptions hold, we will achieve this outcome; and that outcome will contribute to a wider goal. Writing those hypotheses down explicitly makes them easier to test, discuss and monitor.
Stage 1: Stakeholder analysis
Before defining any objectives, list everyone who affects or is affected by the problem. For our WASH NGO that might include pupils, parents, teachers, head teachers, the district education office, the local water authority, community health workers, school management committees and the donor.
For each group, note their interests, their capacity to influence the project and how they are likely to respond. A simple power/interest grid (often attributed to Mendelow) works well here: those with high power and high interest need to be closely involved in design; those with low power but high interest, such as pupils, need meaningful ways to participate and be heard. Skipping this step is one of the most common reasons why technically sound projects stall during implementation.
Stage 2: Building a problem tree
Gather a mixed group of stakeholders and agree on one core problem, written as a negative state rather than an absence of a solution. “High rates of absenteeism among girls in target schools due to illness and inadequate sanitation” is a problem. “Lack of latrines” is not, because it presumes the answer.
Then work downwards to causes and upwards to effects:
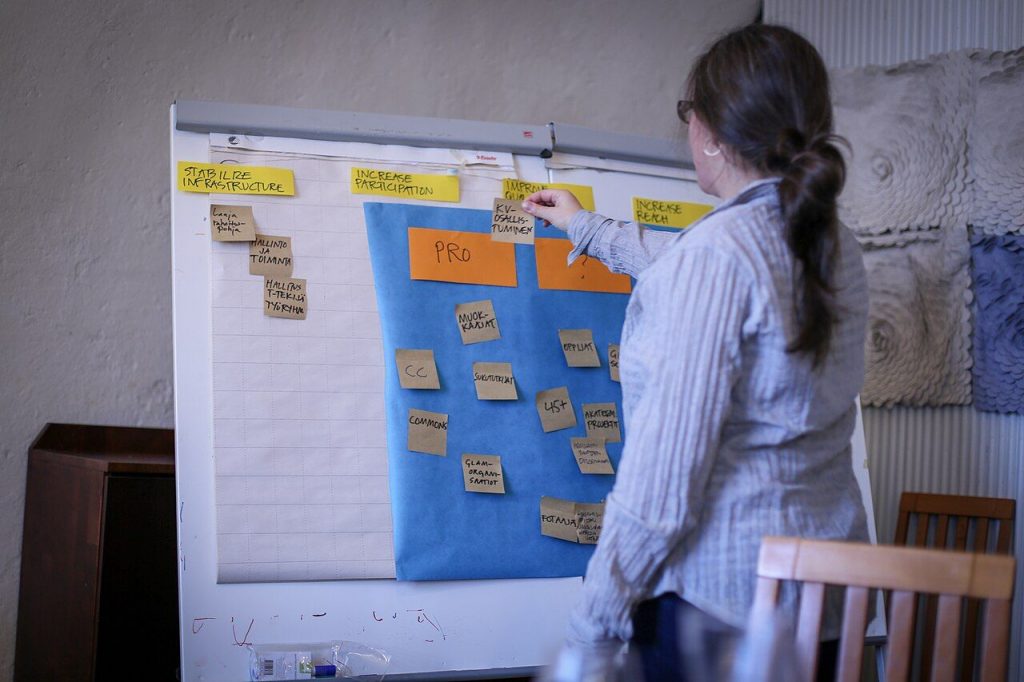
- Write the core problem on a card in the middle of a wall.
- Ask “why does this happen?” and place direct causes below it. Ask “why?” again for each cause, building roots.
- Ask “what happens as a result?” and place effects above, building branches.
- Check every link: does each cause genuinely lead to the problem above it?
In our example, the causes might include: latrines that are broken or not separated by sex; no reliable water point on school grounds; no soap or handwashing stations; limited hygiene knowledge among pupils; no budget or responsibility for maintenance; and no facilities for menstrual hygiene management. Effects might include diarrhoeal illness, lost school days, lower exam performance and girls dropping out.
Stage 3: The objectives tree and strategy selection
Now convert each negative statement into a positive, realistic future state. “Latrines are broken” becomes “Latrines are functional and sex-segregated”. The cause-effect relationships become means-ends relationships: the bottom of the tree describes means, the top describes ends.
You will quickly see that the tree contains several possible strategies, often more than one organisation could deliver. Strategy analysis means choosing which branches to tackle. Useful criteria include:
- Fit with your organisation’s mandate and expertise.
- Likely cost and cost-effectiveness.
- Whether another actor is already working on that branch.
- Sustainability: who will maintain the change after the project ends?
- Risk and feasibility within the funding period.
- Priorities expressed by the people most affected.
Our WASH NGO decides to focus on infrastructure, hygiene promotion and school-level maintenance systems, while leaving curriculum reform to the district education office, which is already working on it. That decision becomes an assumption in the logframe, which we will come back to.
Stage 4: The logframe matrix
The logframe is a four-by-four matrix. The rows describe the intervention logic (goal, outcome, outputs, activities). The columns describe how you will know whether each level has been achieved and what must be true outside your control. Terminology varies between donors (some say “impact” and “specific objective”, others “purpose” and “results”), so always follow your donor’s template, but the structure is the same.
| Level | Intervention logic | Indicators | Means of verification | Assumptions |
|---|---|---|---|---|
| Goal | Improved health and educational participation of children in the target district | Pupil attendance rate in target schools compared with district average | District education statistics | (Not required at goal level in most templates) |
| Outcome | Pupils in 20 target schools use safe sanitation and practise handwashing at critical times | % of pupils observed washing hands with soap after latrine use; % of schools with functioning, sex-segregated latrines at endline | Structured observation at baseline and endline; facility audit | District education office continues its school health curriculum; no major drought affects water supply |
| Output 1 | Functional latrines, water points and handwashing stations installed or rehabilitated | Number of schools with facilities meeting agreed technical standard | Engineer sign-off reports; photos with GPS data | Contractors available at budgeted rates; materials can be transported in rainy season |
| Output 2 | Pupils and teachers trained in hygiene and menstrual health | Number of teachers trained; % of pupils able to name key handwashing moments | Training records; short knowledge survey | Trained teachers remain in post |
| Output 3 | School management committees maintain facilities | Number of committees with an approved maintenance plan and budget line | Committee minutes; school budget documents | Schools are permitted to allocate funds for maintenance |
| Activities | 1.1 Facility assessments; 1.2 Construction; 2.1 Teacher training; 2.2 Hygiene clubs; 3.1 Committee training; 3.2 Maintenance planning | Summarised by inputs and costs (often shown in the budget rather than the matrix) | Schools and communities agree to participate | |
Reading the vertical logic
Read the matrix from the bottom up as a chain of “if… and… then” statements. If we carry out the activities, and schools and communities agree to participate, then the outputs will be delivered. If the outputs are delivered, and the district continues its curriculum work and water supply holds, then the outcome will be achieved. If any link feels weak when you say it aloud, the design needs more work.
A useful discipline is that the project team should be able to guarantee the outputs (within reason) but can only influence the outcome. Many logframes go wrong by placing something at output level that depends on other people’s behaviour, or by placing something at outcome level that is simply the sum of outputs.
Reading the horizontal logic
Read each row from left to right. For every objective, ask: how will we know it has been achieved (indicator), where will that information come from (means of verification), and what external conditions must hold for the next level up to follow (assumption)? If a means of verification costs money, such as a household survey, it must also appear in the budget and the activity plan.
Writing indicators that work
Indicators are where logframes most often become unusable. The SMART test (specific, measurable, achievable, relevant, time-bound) is a good start, but in practice we suggest checking each indicator against five questions:
- Does it describe the change at this level, not the level below?
- Is it clear who is counted, and how? (“Pupils” means all pupils, or only those present on the day of observation?)
- Do we have, or can we collect, a baseline value?
- Is there a realistic target and a date?
- Can we afford to collect it, at the frequency required, with the staff we have?
Where relevant, disaggregate by sex, age and disability. In our example, measuring handwashing knowledge separately for girls and boys, and observing whether latrines are accessible to pupils with disabilities, makes the indicator far more useful than a single headline figure.
Tip: combine quantitative and qualitative indicators at outcome level. A percentage tells you whether practice has changed; a short set of focus group questions tells you why, and helps you adapt if progress is slow.
Assumptions and the “killer assumption”
Assumptions are external conditions that are important for success, that are outside the project’s control and that are reasonably likely to hold. A simple algorithm helps decide what to do with each external factor you identify:
- Is it important for success? If not, leave it out.
- Will it almost certainly hold? If so, leave it out; it adds noise.
- Is it likely to hold? If so, include it as an assumption and monitor it.
- Is it unlikely to hold? Then it is a “killer assumption”. Either redesign the project so the factor is brought within scope, or reconsider whether the project is viable at all.
Assumptions connect directly to your risk register. Each one is, in effect, a risk statement waiting to be written: “If the district education office does not continue its curriculum work, hygiene messages will not be reinforced in lessons.” You will find a companion article on assessing and responding to project risks on the NGO Training blog, and the topic is covered in depth in the Project Management Fundamentals workshop.
From logframe to work plan and budget
The logframe is not a plan on its own. Once the matrix is agreed, break each output into activities, then into tasks with owners, durations and dependencies. That gives you a work breakdown structure, which in turn feeds your schedule (a Gantt chart or a critical path network) and your budget, where every cost line should trace back to an activity.
A practical check: take any budget line at random and ask which activity and output it supports. If nobody can answer, either the line is unnecessary or the logframe is missing something. Techniques for estimating durations and costs, and for finding the critical path through your activities, are covered in our Advanced Project Management Tools & Techniques course.
Common mistakes to avoid
- Starting with the matrix. Filling in the grid before doing the problem and objectives analysis almost always produces a list of activities dressed up as results.
- Too many outcomes. Most donors and methodologies recommend a single outcome (or specific objective) per project. Several outcomes usually mean several projects.
- Outputs that are just activities in the past tense. “Training conducted” is an activity completed. “Teachers able to deliver hygiene sessions” is an output.
- Indicators nobody can measure. If you cannot describe how the data will be collected, by whom and at what cost, the indicator will not survive implementation.
- Writing it alone. A logframe drafted by one person at headquarters rarely reflects reality on the ground. Involve field staff and, where possible, the people the project serves.
- Freezing it. A logframe that is never revisited after approval becomes a reporting burden rather than a management tool.
Using the logframe during implementation
The logframe earns its keep after the contract is signed. Use it to structure quarterly reviews: are the outputs on track, are the indicators moving, do the assumptions still hold? Build your monitoring plan directly from the indicators and means of verification columns, with a named person responsible for each.
When circumstances change, propose revisions rather than reporting against targets that no longer make sense. Donors generally respond better to a well-argued change request, backed by monitoring evidence, than to a final report explaining why the original targets were missed.
Logframe or theory of change?
The two tools are often presented as rivals, but they work best together. A theory of change maps the wider set of pathways, preconditions and actors involved in bringing about a long-term change, and is usually richer and more narrative. The logframe takes the slice of that theory your project is responsible for and expresses it in a compact, measurable format.
Logframe quality checklist
- Stakeholder analysis completed and key groups involved in design.
- Core problem stated as a negative condition, not a missing solution.
- One clear outcome, worded as a change in behaviour, practice or condition.
- Outputs are deliverables the team can guarantee; activities are actions.
- Vertical logic reads naturally as “if… and… then”.
- Two or three indicators per level, each with baseline, target and date.
- Every means of verification is costed and scheduled.
- Assumptions are external, important and likely; no killer assumptions remain.
- Each budget line traces to an activity.
- Review points are scheduled to revisit the logframe during implementation.
Key takeaways
- The Logical Framework Approach is a process; the logframe matrix is only its summary.
- Invest time in stakeholder, problem and objectives analysis before touching the matrix.
- Read the vertical logic aloud as “if… and… then” to test your design.
- Choose fewer, better indicators and make sure you can afford to measure them.
- Treat assumptions as risks to monitor, and revisit the logframe regularly during implementation.
If you would like to practise building problem trees and logframes with real NGO examples, join our one-day Project Management Fundamentals workshop in Brussels, or get in touch to discuss an in-house session tailored to your team’s projects.